

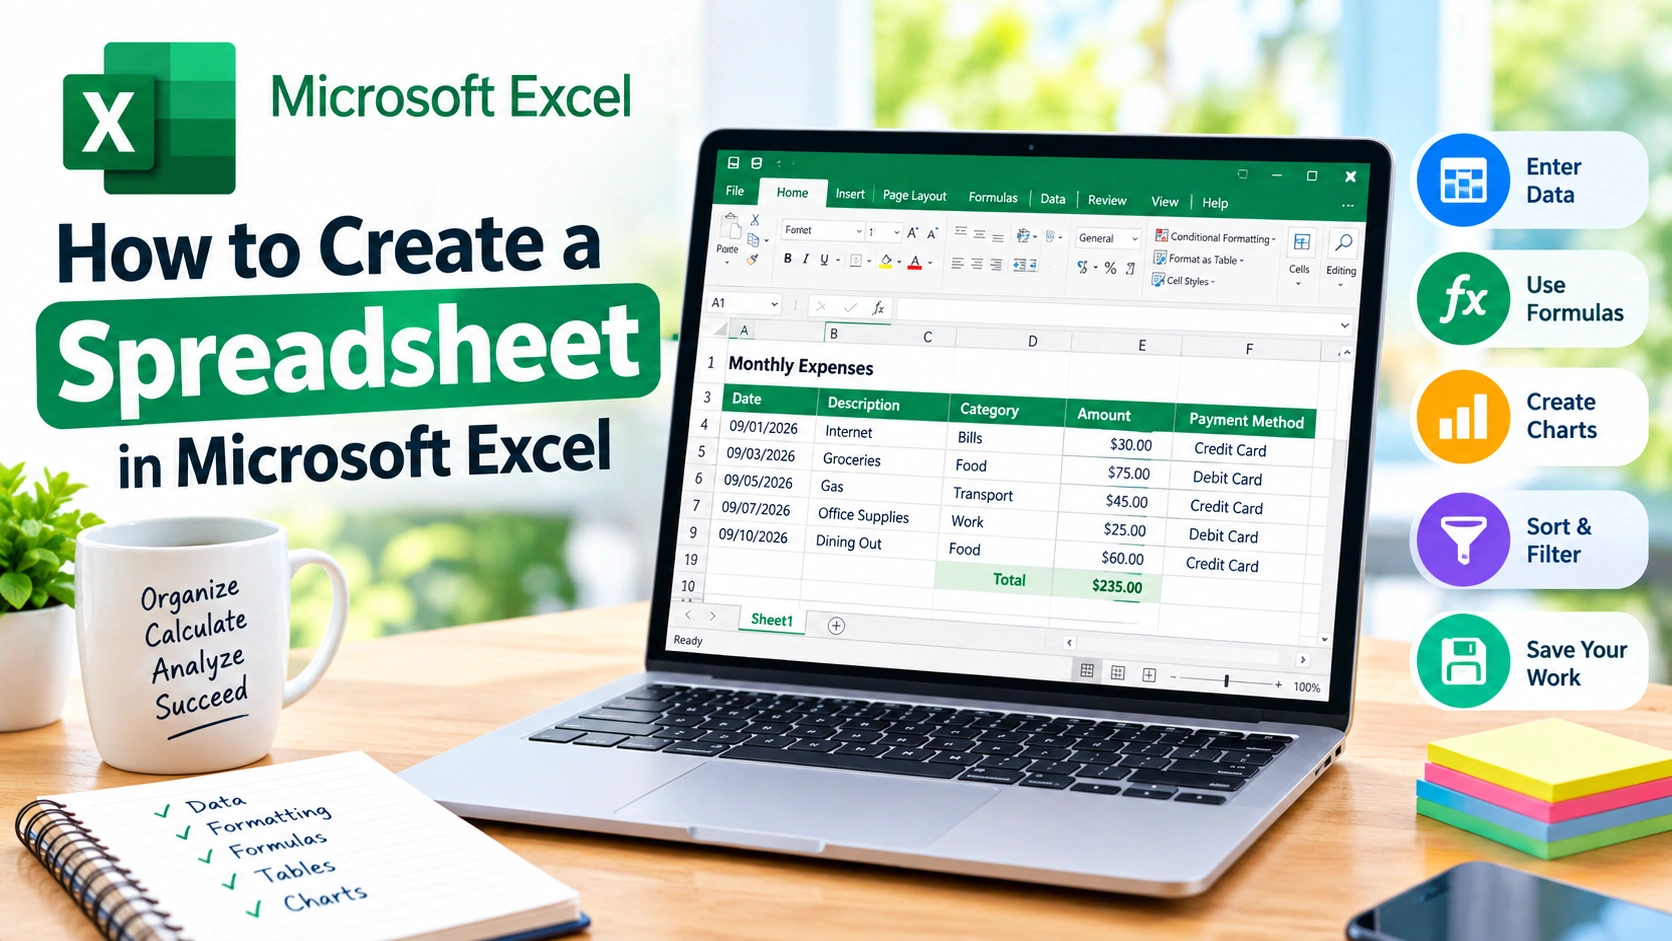
Creating a spreadsheet in Microsoft Excel is one of the easiest ways to organize information, perform calculations, track data, and present numbers clearly. Whether you need a simple household budget, a project tracker, an inventory list, or a business report, Excel provides the tools you need to build a useful spreadsheet from scratch.
In this guide, you’ll learn how to create a spreadsheet in Microsoft Excel, enter and organize data, format your worksheet, use formulas, create tables, save your file, and improve your spreadsheet with practical features.
What Is a Microsoft Excel Spreadsheet?
A spreadsheet is a digital document made up of rows and columns. In Microsoft Excel, the intersection of a row and column is called a cell. Each cell can contain text, numbers, dates, formulas, or other types of information.
For example, you could create a simple monthly expense spreadsheet with columns for:
- Date
- Description
- Category
- Amount
- Payment Method
Excel can then calculate totals automatically and help you analyze your spending.
How to Create a Spreadsheet in Microsoft Excel
Follow these steps to create a basic spreadsheet.
1. Open Microsoft Excel
Start Microsoft Excel from your Windows Start menu, desktop, or application launcher.
Depending on your version of Excel, you may see a start screen with several templates.
Select Blank workbook to create a spreadsheet from scratch.
Excel will open a new workbook containing a worksheet.
2. Understand the Excel Worksheet
Before entering information, it helps to understand the basic layout.
An Excel worksheet contains:
- Columns identified by letters such as A, B, C, and D
- Rows identified by numbers such as 1, 2, 3, and 4
- Cells identified by addresses such as A1 or B5
- Formula bar for viewing and editing cell contents
- Ribbon containing Excel’s commands and tools
- Worksheet tabs at the bottom for switching between sheets
The selected cell is called the active cell.
3. Enter Your Data
Click a cell and start typing.
For example, you could create an expense tracker like this:
| Date | Description | Category | Amount |
|---|---|---|---|
| 09/01/2026 | Internet | Bills | 30 |
| 09/03/2026 | Groceries | Food | 75 |
| 09/05/2026 | Gas | Transport | 45 |
| 09/07/2026 | Office supplies | Work | 25 |
Press Enter after entering a value to move to the next row.
You can also press Tab to move to the next column.
4. Add Column Headings
Column headings make your spreadsheet easier to understand.
Place a descriptive heading at the top of each column. For example:
- Product
- Quantity
- Price
- Total
Avoid vague headings when possible. A clear heading makes it easier to understand what the information represents.
How to Format a Spreadsheet in Excel
Once you’ve entered your data, formatting can make the spreadsheet easier to read.
Bold Your Headings
Select the heading cells and click Bold on the Home tab.
You can also use the keyboard shortcut Ctrl+B.
Adjust Column Width
If your text is cut off, adjust the column width.
Move your mouse pointer to the boundary between two column letters and drag it to increase or decrease the width.
You can also double-click the boundary to automatically fit the column to its contents.
Change Number Formats
Excel supports several number formats, including:
- Currency
- Percentage
- Date
- Decimal
- Accounting
For example, if a column contains prices, select the cells and choose an appropriate currency format from the Number section of the Home tab.
Add Borders
Borders can help separate headings and groups of information.
Select the cells you want to format, then use the Borders option on the Home tab.
Avoid adding excessive borders, as they can make a large spreadsheet harder to read.
How to Use Formulas in an Excel Spreadsheet
One of Excel’s most useful features is its ability to perform calculations automatically.
Excel formulas normally begin with an equal sign (=).
For example:
=B2+C2This adds the values in cells B2 and C2.
You can also multiply values:
=B2*C2Or calculate a difference:
=B2-C2Use SUM to Add Numbers
The SUM function is useful for calculating totals.
For example:
=SUM(D2:D10)This adds all values from D2 through D10.
Use AVERAGE to Calculate an Average
To calculate the average of a range:
=AVERAGE(D2:D10)This can be useful for analyzing sales, grades, expenses, or other numerical data.
Use MAX and MIN
To find the largest value:
=MAX(D2:D10)To find the smallest value:
=MIN(D2:D10)These functions can quickly identify the highest and lowest numbers in a dataset.
How to Turn Data Into an Excel Table
If you’re working with a list of related information, converting it into an Excel Table can make the data easier to manage.
- Select your data.
- Open the Insert tab.
- Select Table.
- Confirm the selected range.
- Make sure My table has headers is selected if your first row contains headings.
- Click OK.
An Excel Table provides useful features such as filtering, sorting, automatic formatting, and easier data expansion.
How to Sort Data in Excel
Sorting can help you organize information alphabetically or numerically.
For example, you could sort a product list by:
- Product name
- Price
- Quantity
- Date
Select a cell in the column you want to sort and use the Sort & Filter options on the Home or Data tab.
Always make sure Excel is sorting the entire dataset rather than only one column. Otherwise, information can become mismatched.
How to Filter Spreadsheet Data
Filters allow you to temporarily display only the information you need.
For example, an expense spreadsheet could be filtered to show only:
- Food expenses
- Purchases above a certain amount
- Expenses from a particular month
- A specific payment method
If you’ve converted your range into a table, filter controls are normally available in the column headings.
How to Freeze Rows or Columns
Large spreadsheets can become difficult to navigate when you scroll away from the headings.
Excel’s Freeze Panes feature lets you keep important rows or columns visible.
To freeze a heading row:
- Open the View tab.
- Select Freeze Panes.
- Choose the appropriate option.
This is particularly useful when working with spreadsheets containing hundreds or thousands of rows.
How to Create Multiple Worksheets
A workbook can contain multiple worksheets.
For example, a personal finance workbook might contain:
- January
- February
- March
- Annual Summary
Click the + button near the worksheet tabs to add another sheet.
You can also right-click a worksheet tab to rename, move, copy, or delete it.
How to Create a Chart From Spreadsheet Data
Charts can turn numerical information into a visual format.
To create a chart:
- Select the data you want to visualize.
- Open the Insert tab.
- Choose a chart type.
- Select a suitable chart style.
Common Excel chart types include:
- Column charts
- Bar charts
- Line charts
- Pie charts
- Area charts
Choose a chart type based on what you want the reader to understand. For example, a line chart can be useful for showing changes over time.
How to Save an Excel Spreadsheet
When you’re finished creating your spreadsheet, save it so you don’t lose your work.
Select File > Save As and choose where you want to store the workbook.
Excel’s standard workbook format is:
.xlsxGive your file a descriptive name, such as:
Monthly_Expenses_2026.xlsxA meaningful filename makes it easier to find the spreadsheet later.
Tips for Creating Better Excel Spreadsheets
A well-designed spreadsheet should be easy to understand and maintain.
Keep Your Data Organized
Use one column for each type of information. For example, don’t combine a person’s name, phone number, and email address into one cell if you need to sort or filter those details separately.
Use Consistent Formatting
Use the same date, currency, and number formats throughout your spreadsheet.
Avoid Unnecessary Merged Cells
Merged cells can sometimes interfere with sorting, filtering, and other Excel features. Use them sparingly, particularly in the main data area.
Use Descriptive Names
Instead of naming a worksheet “Sheet1,” consider names such as:
- Sales
- Inventory
- Expenses
- Customers
Keep Formulas Simple
Simple formulas are usually easier to understand and troubleshoot. If a spreadsheet becomes complicated, consider breaking the calculations into logical sections.
Back Up Important Workbooks
Important spreadsheets should be backed up regularly. Consider keeping an additional copy in a secure cloud storage location or another appropriate backup location.
Common Problems When Creating an Excel Spreadsheet
Data Appears Incorrectly
Check the cell’s number format. A number formatted as a date, percentage, or currency may display differently than expected.
Formula Shows an Error
Check the formula for incorrect cell references, missing parentheses, or invalid function names.
Columns Are Too Narrow
Resize the columns manually or use AutoFit to make the contents visible.
Data Becomes Misaligned After Sorting
Make sure you select the complete dataset or use an Excel Table before sorting. Sorting a single column independently can separate values from their corresponding records.
Spreadsheet Becomes Difficult to Manage
For large datasets, use tables, filters, sorting, freeze panes, and clearly labeled worksheets to keep information organized.
Frequently Asked Questions
Can I create an Excel spreadsheet for free?
Microsoft Excel is generally part of Microsoft 365 or a separately licensed Microsoft product, although Microsoft also offers web-based spreadsheet functionality through its online services. Availability and features can vary by account and platform.
How do I create a simple spreadsheet in Excel?
Open Excel, select Blank workbook, enter your column headings and data, format the information as needed, and save the workbook as an .xlsx file.
What is the difference between an Excel workbook and worksheet?
A workbook is the Excel file itself. A worksheet is an individual spreadsheet inside that workbook. One workbook can contain multiple worksheets.
How do I add a formula to Excel?
Select a cell, type an equal sign followed by the calculation or function, and press Enter. For example, =SUM(B2:B10) adds the values in cells B2 through B10.
How many rows and columns can an Excel worksheet have?
Modern Excel worksheets contain a large grid of rows and columns, allowing you to work with substantial datasets. The exact limits depend on the Excel version and file format.
Can I create a spreadsheet without knowing formulas?
Yes. You can create useful Excel spreadsheets using basic data entry, formatting, tables, sorting, and filtering without writing formulas. Formulas become useful when you want Excel to perform calculations automatically.
Final Thoughts
Learning how to create a spreadsheet in Microsoft Excel gives you a practical way to organize information and automate everyday calculations. Start with clear headings, enter your data consistently, and use basic formatting to make the worksheet easy to read.
As your needs grow, features such as Excel Tables, formulas, filters, charts, and Freeze Panes can help you turn a basic worksheet into a powerful tool for managing and analyzing data.